Temperature Control Testing
How to Test Smart Shower Temperature Control: Response, Overshoot, Oscillation, and Stability
Learn how response time, overshoot, oscillation, steady-state error, and long-term variation are measured in smart shower temperature-control tests.
What should a smart shower temperature test measure?
A smart shower temperature-control test should measure more than the final display value. It needs to show how quickly the mixed water responds, whether it overshoots, whether it repeatedly crosses the target, how close it remains during a defined stable period, and what happens when pressure, inlet temperature, flow, or outlet mode changes.
The user feels water temperature, not controller activity. A display can show the target while the physical sensor is still approaching it. A final sample can land inside tolerance even though the preceding transition was uncomfortable. Testing must therefore preserve the full time series.
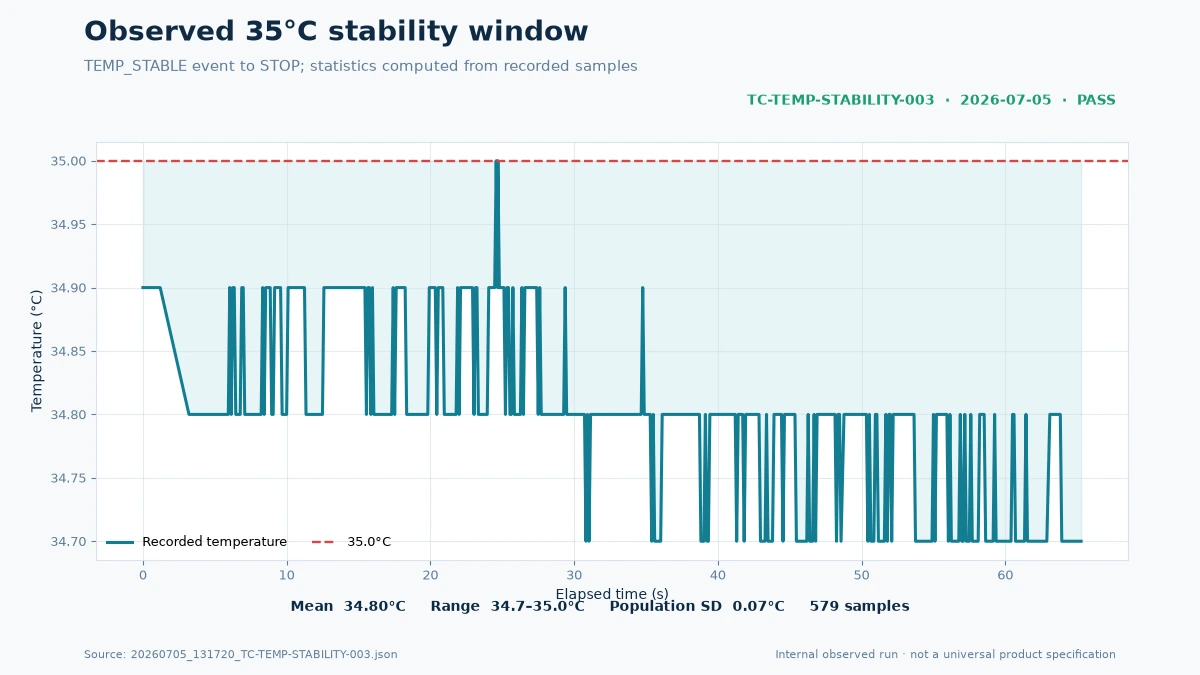
The article cover and observed chart below are generated from the recorded WUGONG hardware-test log TC-TEMP-STABILITY-003. Both use only samples between TEMP_STABLE and STOP and state the limits of that observation.
The five temperature-control metrics
Response time
Response time measures how long the system takes to satisfy a defined condition after a start or setpoint change. “Reached the target” must be explicit: first crossing, entry into a tolerance band, or continuous residence inside that band for a specified duration produce different answers.
Overshoot and undershoot
Overshoot is the highest excursion above the target during the defined response window; undershoot is the corresponding excursion below it. Both need a clear start and end. Data after the user presses STOP or after flow has ended should not be mixed into the running-water result.
Oscillation
Repeated movement above and below the target can indicate an aggressive controller, slow sensor placement, mechanical backlash, quantized actuator steps, supply disturbances, or interaction between the algorithm and the hydraulic path. Frequency and amplitude matter more than a single crossing.
Steady-state error
Steady-state error is the difference between the target and the average observed temperature over a defined stable window. Report the signed error as well as the absolute value so a persistent hot or cold bias remains visible.
Long-term variation
Minimum, maximum, range, standard deviation, and time outside the tolerance band describe variation during the observation period. These statistics only have meaning when the sample window and operating conditions are stated.
PID is one control method, not the test itself
PID combines proportional, integral, and derivative terms to adjust an output from the current error, accumulated error, and rate of change. A smart shower may use PID, feedforward, lookup tables, state-dependent rules, filtered control, or a hybrid.
The test should not assume a particular algorithm unless the implementation is known. Response, overshoot, stability, safety, and disturbance recovery are observable product behaviors. PID terms and actuator traces can help explain those behaviors in a WUGONG implementation, but an article about “PID testing” must not imply that every smart shower uses the same controller.
How the hydraulic system affects the curve
Temperature control is a closed loop around real water. Hot and cold inlet temperatures, dynamic pressure, pipe volume, valve geometry, actuator speed, sensor position, sampling interval, flow setting, and outlet restriction all affect the curve.
Changing flow can alter both the total opening and the hot-to-cold ratio required for the same target. Switching outlets can change backpressure and the amount of water between the mixing point and the user. A controller tuned on one bench setup may behave differently in a concealed installation with longer pipework.
Design a reproducible temperature test
Record at least:
- product, valve, controller and firmware version;
- hot and cold inlet temperatures and dynamic pressures where available;
- supply voltage, selected outlet, flow setting, and pipe or fixture setup;
- target temperature and any setpoint sequence;
- sample rate and sensor source;
- response, tolerance, stable-duration, and observation-window definitions;
- stop event, invalid-sample rules, and fault behavior.
Run repeated trials from comparable starting states. Add planned disturbances—such as flow changes or controlled inlet variation—only after the basic test is safe and repeatable. A configured tolerance is an acceptance criterion, not proof of performance.
Observed example: recalculate the stable window
One internal log, TC-TEMP-STABILITY-003, recorded a 35°C test on July 5, 2026. The file contains a TEMP_STABLE event at 7.537 seconds and a STOP command at 72.819 seconds. Recalculating only the 579 samples between those events gives:
- window duration: 65.282 seconds;
- mean temperature: 34.80°C;
- minimum and maximum: 34.7°C and 35.0°C;
- population standard deviation: 0.07°C after rounding.
This example demonstrates correct windowing, not a universal WUGONG product specification. The structured file did not preserve the hot and cold inlet conditions needed for a public performance claim. Samples after STOP rose above the running window; including them would have distorted the stated range. The safe conclusion is that this recorded run remained within the values above under its undocumented bench supply conditions.
Read temperature and actuator data together
In WUGONG's current FaucetCore architecture, separate stepper motors adjust hot and cold valves while a downstream sensor measures mixed-water temperature. When temperature drifts, actuator traces help distinguish different causes:
- actuator targets change but positions do not: investigate motion or feedback;
- positions move repeatedly around the same range: inspect tuning, backlash, or noisy input;
- both valves reach limits: the requested target may be unavailable under the inlet conditions;
- temperature changes before meaningful actuator movement: inspect supply disturbance or sensor timing;
- reported target and running state disagree: inspect protocol or state logic.
An actuator trace explains the controller's attempt; it does not by itself prove how much water moved through the valve.
Safety and comfort are separate acceptance layers
A narrow stable band is useful, but safety requires additional tests: maximum-temperature limits, sensor disconnection or implausible values, loss of hot or cold supply, stalled actuators, communication loss, restart behavior, and user STOP response. These tests must be designed so the fixture and operator remain protected.
Comfort criteria can be stricter than a safety limit. Define both, and do not turn one successful stability run into evidence that every protective path has been tested.
Frequently asked questions
Is a larger PID value better?
No. PID parameters interact with the hydraulic system and each other. Larger gains can speed one response while increasing overshoot, oscillation, noise sensitivity, or actuator wear.
How long should a shower take to reach temperature?
There is no universal number without a defined start point, inlet conditions, pipe volume, flow, target, and stable-band rule. Compare results made with the same method.
Is a brief overshoot always unsafe?
Risk depends on temperature, duration, location of measurement, actual water reaching the user, and applicable safety requirements. It should be recorded and evaluated, not dismissed because the final value is correct.
Why does pressure affect temperature control?
Pressure changes alter the hot- and cold-water flows produced by the same valve positions. The controller must detect the resulting mixed-temperature change and compensate within its mechanical and safety limits.
What proves temperature stability?
A defined continuous observation window with timestamped measurements, stated conditions, a calculation method, and results such as mean, range, variation, time in band, and relevant actuator or event data.